South City Park
South City Park is bordered by Colfax Ave to the South, York St to the East, 17th Ave to the north, and Colorado Blvd to the east.
 South City Park Demographics
3,591
Total Population
Denver Population: 706,799
34.6
Median Resident Age
Denver Median Resident Age: 35.5
$56,500
Median Income Per Resident
Denver Median Income Per Resident: $53,437
$85,429
Median Income Per Household
Denver Median Income Per Household: $85,721
$1,232
Median Rent
Denver Median Rent: $1,143
$630,200
Median Home Value
Denver Median Home Value: $513,621
34%
% homes owner occupied (vs. renter)
Denver % of homes owner occupied (vs. renter): 46.4%
89%
% homes occupied (vs. vacant)
Denver % home occupied (vs. vacant): 94%
 Public Safety
Denver Police District 2
Address: 1566 N Washington St.
Phone: 720-913-2800
Technician
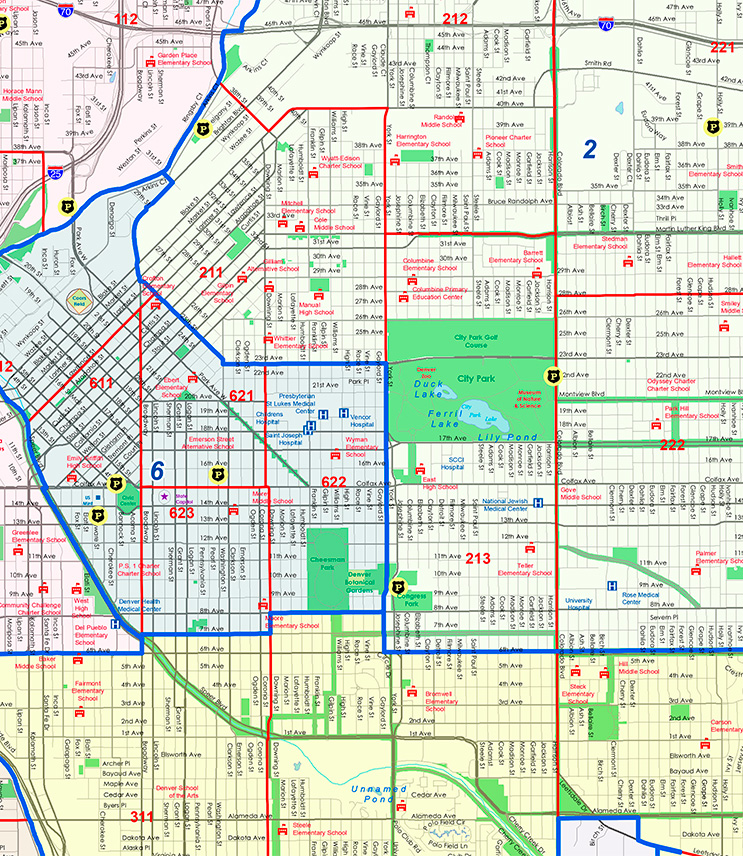
Denver Police Districts Map
The map above shows the outline of Police Districts 2 & 6 within the boundaries of Denver District 10.
South City Park – Year Home Was Built
Data for Year Home Was Built-South City Park Compared to Denver
| Year Home Was Built | South City Park | Denver |
|---|---|---|
| Before 1939 | 33% | 18% |
| 1940 – 1949 | 1% | 6% |
| 1950 – 1959 | 5% | 14% |
| 1060 – 1969 | 10% | 11% |
| 1970 – 1979 | 6% | 13% |
| 1980 – 1989 | 2% | 8% |
| 1990 – 1999 | 5% | 7% |
| 2000 – 2009 | 20% | 11% |
| 2010 – 2013 | 13% | 13% |
| After 2013 | 0% | 0.3% |
South City Park – Resident Ethnicity
Data for Resident Ethnicity-South City Park Compared to Denver
| Resident Ethnicity | South City Park | Denver |
|---|---|---|
| White | 78.4% | 57.5% |
| Hispanic | 9.5% | 27.4% |
| Black | 8.3% | 7.5% |
| Asian | 1.5% | 3.1% |
| Other | 0.0% | 0.3% |
| Two or more | 2.3% | 3.7% |
South City Park – Resident Education Level
Data for Resident Education Level-South City Park Compared to Denver
| Resident Education Level | South City Park | Denver |
|---|---|---|
| Bachelor or higher | 79% | 53% |
| Some college | 13% | 22% |
| HS grad or Equiv | 6% | 16% |
| Less than HS | 2% | 10% |
South City Park – Resident Age
Data for Resident Age-South City Park Compared to Denver
| Resident Age | South City Park | Denver |
|---|---|---|
| 0 to 9 | 29% | 11% |
| 10 – 19 | 7% | 10% |
| 20 – 29 | 20% | 18% |
| 30 – 39 | 27% | 21% |
| 40 – 49 | 12% | 14% |
| 50 – 59 | 6% | 10% |
| 60 – 69 | 8% | 9% |
| 70 – 79 | 6% | 5% |
| 80+ | 6% | 3% |
 South City Park History
City Park sat a mile away from the rest of Denver when it was first opened. Competing trolley companies took park-goers along the undeveloped roads into the park. Slowly, the neighborhood developed, starting with farmers and squatters who used the city ditch to irrigate their crops. In 1890, Henry Lee sponsored a bill in the State Legislature authorizing municipalities to acquire lands in excess of the then current 40-acre limit for parks. After the bill passed and years of litigation over land ownership had been settled, Denver purchased the City Park site for $56,000 in 1889. At that time there were few trees and the vegetation consisted of buffalo grass, sage brush and cactus.
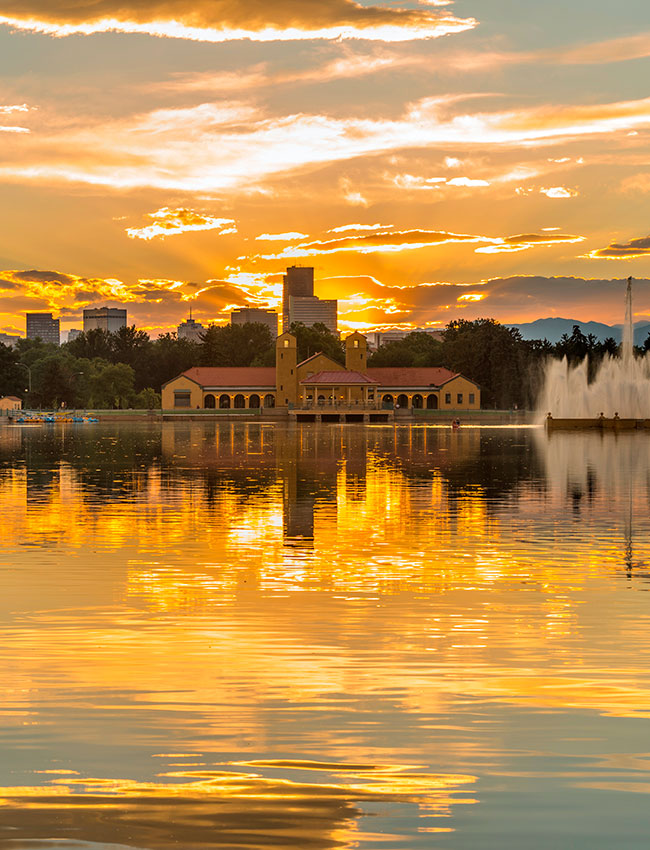
The 1895 World’s Columbian Exposition in Chicago inspired Denver’s leaders to contemplate a new approach to city planning. The City Beautiful movement was a philosophy of urban planning reform that focused on the monumental magnificence and beautification of cities. As demonstrated in Chicago, a city shaped with Greek Revival architecture, parks, gardens, and public art could rouse civic virtue and enhance the quality of life of all citizens. The 80-acre Denver Zoo was established in 1896, served as a plant nursery for the Denver Park and Parkway System. The center of the park includes two large constructed recreational lakes with historic fountains, multi-use pavilions, and islands. East of the lakes at a higher elevation, the Denver Museum of Natural History was established in 1901 in a neoclassical building on a hill providing scenic vistas.
The Mercy Sanitarium was also founded in 1901 by a group of five nuns from St. Louis to practice health in Colorado. While it initially started with a 40-bed capacity, an addition was built in 1903, which provided accommodations for 85 more patients. At the same time, the facility’s name was changed to Mercy Hospital.
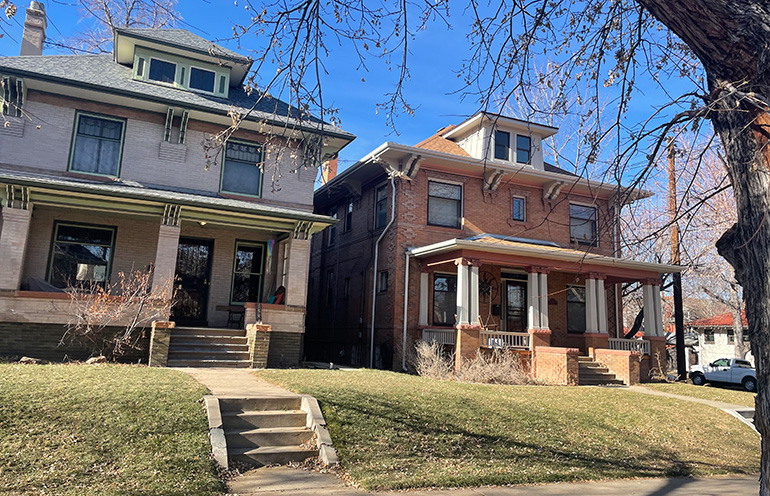
It wasn’t until later in the 20th century with better trolley connections that housing development occurred in force. The construction of East High School (Denver’s first high school which moved from downtown) in 1925 also led to rapid development of the neighborhood. The magnificent structure was built to accommodate 2,130 students, and was furnished with the latest in modern high school equipment. Mercy Hospital also grew during this time. From 1905 to 1932, the hospital underwent constant construction and remodeling which brought the facility to a capacity of 250 beds. The neighborhood also changed significantly in this time period. Many historic brick residential buildings, including many Denver square style homes and several historic brick commercial structures were built during this time.
Colfax Avenue also served as a vital economic channel during this period. Continuous development (mostly residential in nature) along the street and north and south into adjacent neighborhoods extended as far east as Steele Street; a small area of vacant land remained between there and National Jewish Hospital to the east. Some commercial land uses also began to appear. The most intense early business development along the avenue was located near the intersection of East Colfax and York Street. A commercial nucleus of one-story storefronts was situated on both sides of the street on the blockfaces east of York. The Colfax Avenue Floral Company, with its large complex of greenhouses, operated to the east, on the north side of Colfax. In 1925, the City and County of Denver adopted a zoning code for the city. With a few exceptions, the blocks of East Colfax Avenue from Broadway to Yosemite Street were designated business or commercial. The city’s first Master Plan document in 1929 described East Colfax as “formerly a principal residential street, and now in large part zoned for business and the principal artery through the Capitol Hill apartment district.” A series of widenings along the avenue removed trees and terraced front lawns.
The 1920s saw a boom in commercial building construction along East Colfax. This expansion was driven by the street’s status as a transcontinental highway, good streetcar access, and business zoning. A variety of commercial structures were erected along the avenue during the period: one-story buildings with multiple storefronts; multi-story buildings with storefronts on the first story and apartments above, and multi-story buildings with offices and storefronts. Significant educational, religious, entertainment, and special purpose facilities were also completed. Although construction declined precipitously during the Great Depression and World War II, a few commercial buildings and apartments were erected.
Over the course of the 20th century, City Park became the crown jewel of Denver’s park system, prominent as a place for socializing and play in all seasons. There were sports and picnics in the summer, skating and sledding in the winter. Music and dance were featured at the bandstand, placed next to one of the country’s first electric fountains, with its dramatic light and dancing water display. S.R DeBoer worked with numerous collaborators including Olmsted Brothers to develop Kessler’s design. In the first three decades a number of commemorative park entrances, fountains, and memorials were installed. Extending the southwest corner of the park to Colfax Avenue, the French promenade-inspired City Park Esplanade designed by Kessler includes a gateway designed by Edward Bennett. Thematic gardens in the southeast section of the park including a labyrinthine collection of juniper and the nearby Box Canyon and Waterway, both designed by DeBoer in the 1950s. In 1986 City Park was included in the National Register of Historic Places listing of the Denver Park and Parkway System.
Today, the South City Park neighborhood serves as one of Denver’s premier residential neighborhoods. Its close proximity to small businesses, cultural facilities, and the park make it one of Denver’s best areas to live, work, and play.
While technically the City Park neighborhood was included in the city by Territorial Sessions Laws of 1874, the area remained disconnected from the rest of Denver until the construction of City Park in 1882. Constructed on gently rolling plains and irrigated by the City Ditch, City Park was originally laid out by civic engineer Henry Meryweather and redesigned by George Kessler and Reinhard Schuetze at the turn of the century.